


The content below is taken from the original ( Microsoft Simplifies IT Monitoring with New Azure Managed Grafana Service), to continue reading please visit the site. Remember to respect the Author & Copyright.
Last year, Microsoft unveiled its plans to create a fully-managed version of Grafana that runs natively on its Azure cloud platform. Now, the Redmond giant has announced that the new Azure Managed Grafana service is now available in public preview.
Grafana is basically an open-source platform that enables organizations to visualize multiple types of reliability data in a single dashboard. It provides graphs, charts, and alerts that simplify the task of detecting technical issues in business environments. Previously, enterprise customers used the self-managed open-source product to deploy Grafana on Azure.
The new Azure Managed Grafana enables organizations to access the platform without managing the underlying infrastructure. It helps IT Admins detect technical issues across on-premises and Azure environments, as well as other cloud platforms.
“Grafana helps you bring together metrics, logs and traces into a single user interface. With its extensive support for data sources and graphing capabilities, you can view and analyze your application and infrastructure telemetry data in real-time,” Microsoft explained in a support document.
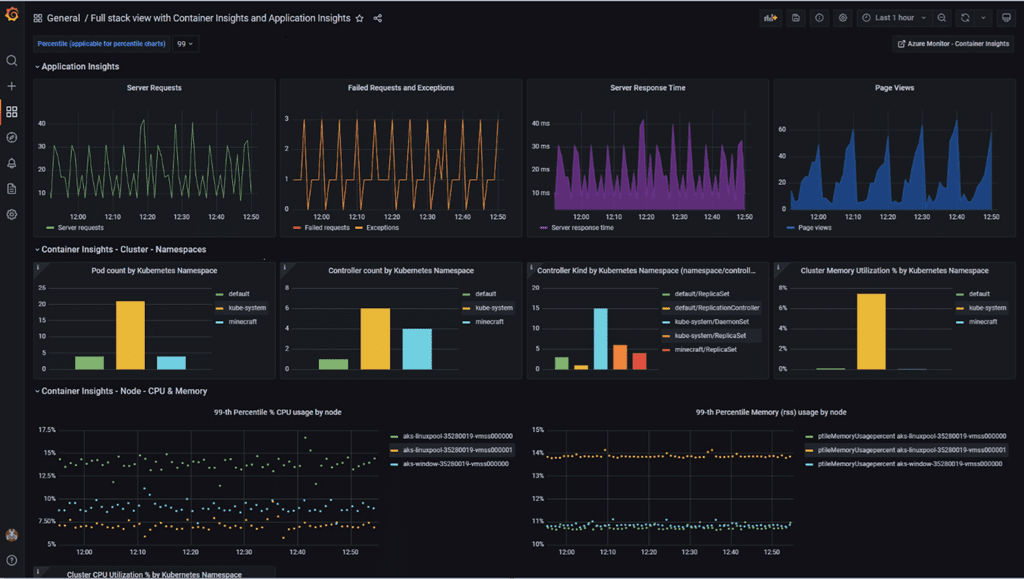
Azure Monitor gets new Grafana integrations
In addition to the new service, Microsoft has announced some new Grafana integrations with Azure Monitor. It is now possible to quickly pin Azure Monitor visualizations from Azure Portal to new and existing Grafana dashboards.
Moreover, the new Azure Grafana service has built-in support for Azure Data Explorer, a real-time data analytics and data exploration service for large volumes of streaming data. With this service, customers can view the telemetry data of connected devices right from the Grafana dashboard.
Microsoft has introduced new “out-of-the-box” Grafana dashboards that make it easier for customers to visualize data from Azure Monitor. These dashboards come with several built-in features such as Azure Monitor insights, Azure alerts, and much more. This feature should eliminate the need to create data visualizations from scratch.
Lastly, Microsoft highlights that the new service also integrates with Azure Active Directory. It allows organizations to easily manage user permissions and access control via Azure Active Directory identities. This integration should make it easier for IT Admins to secure their Azure Managed Grafana deployments.
Microsoft is offering a free 30 days trial of its Azure Managed Grafana service, and you can find more details on the official website.