


The content below is taken from the original ( Amazon Managed Grafana – Getting Started), to continue reading please visit the site. Remember to respect the Author & Copyright.
Amazon Managed Service for Grafana (AMG) is a fully managed and secure data visualization service that enables customers to instantly query, correlate, and visualize operational metrics, logs, and traces for their applications from multiple data sources. AMG is based on the open source Grafana project, a widely deployed data visualization tool popular for its extensible data source support. Developed together with Grafana Labs, AMG manages the provisioning, setup, scaling, and maintenance of Grafana, eliminating the need for customers to do this themselves. Customers also benefit from built-in security features that enable compliance with governance requirements, including single sign-on, fine-grained data access control, and audit reporting. AMG is integrated with AWS data sources that collect operational data, such as Amazon CloudWatch, Amazon Elasticsearch Service, Amazon Timestream, AWS IoT SiteWise, AWS X-Ray, and Amazon Managed Service for Prometheus (AMP), and provides plug-ins to popular open-source databases, third-party ISV monitoring tools, as well as other cloud services. With AMG you can easily visualize information from multiple AWS services, AWS accounts, and Regions in a single Grafana dashboard.
You can also perform an in-place upgrade to Grafana Enterprise to get access to additional features and plugins. With Grafana Enterprise, you can consolidate your data from AppDynamics, DataDog, Dynatrace, New Relic, MongoDB, Oracle Database, ServiceNow, Snowflake, Splunk, and Wavefront. Additionally, you can access support and training content directly from Grafana Labs to help you explore and adopt Grafana’s advanced features easily. Click here to learn more.
Before you begin
To use AMG in a flexible and convenient manner, we chose to leverage AWS Single Sign-On (SSO) for user management. AWS SSO is available once you’ve enabled AWS Organizations. In order to check whether an AWS account is part of an AWS Organization, head over to https://console.aws.amazon.com/organizations/ and you should see a view akin to the following and if you do not see AWS Organizations activated go ahead and create one:
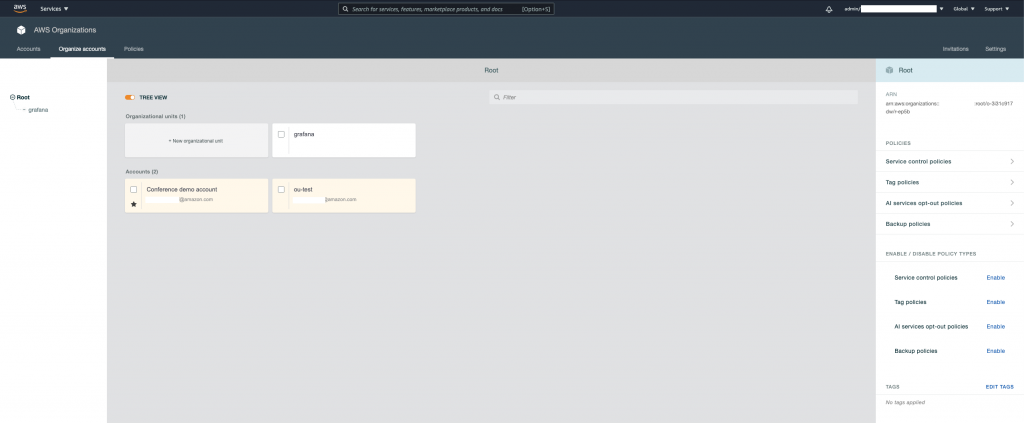
Existing AWS Organization
AMG integrates with AWS SSO so that you can easily assign users and groups from your existing user directory such as Active Directory, LDAP, or Okta within the AMG workspace and single sign on using your existing user ID and password. This allows you to enforce existing login security requirements for your company such as two-factor authentication and password complexity.
If you don’t have an existing user directory or do not want to integrate with external identity providers through the Security Assertion Markup Language (SAML) 2.0 standard, you can create local users and passwords within AWS SSO and use them to sign in to the Grafana workspace:
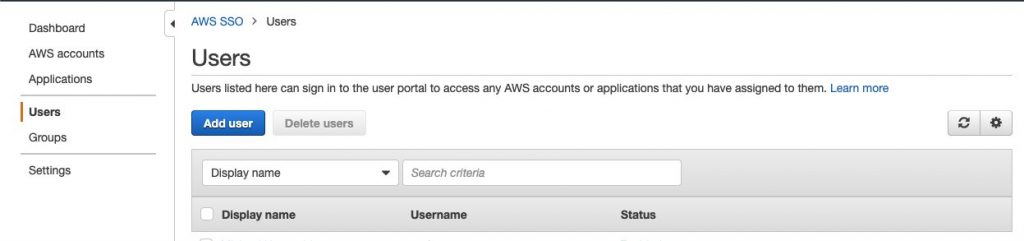
SSO console: add user
With the preparations around AWS SSO and AWS Organizations out of the way, we’re ready to get into the core AMG setup.
Setting up AMG on your AWS account
You can easily spin up on-demand, autoscaled Grafana workspaces (virtual Grafana servers) that enable you to create unified dashboards across multiple data sources. Before we can use AMG for the following example, we need to set it up. In the following we’re using the AWS console to walk you through the required steps and comment on things to consider when performing each step.
After you hit the Create workspace button in the right upper corner of the AMG console landing page, give your new workspace a name and optionally a description:
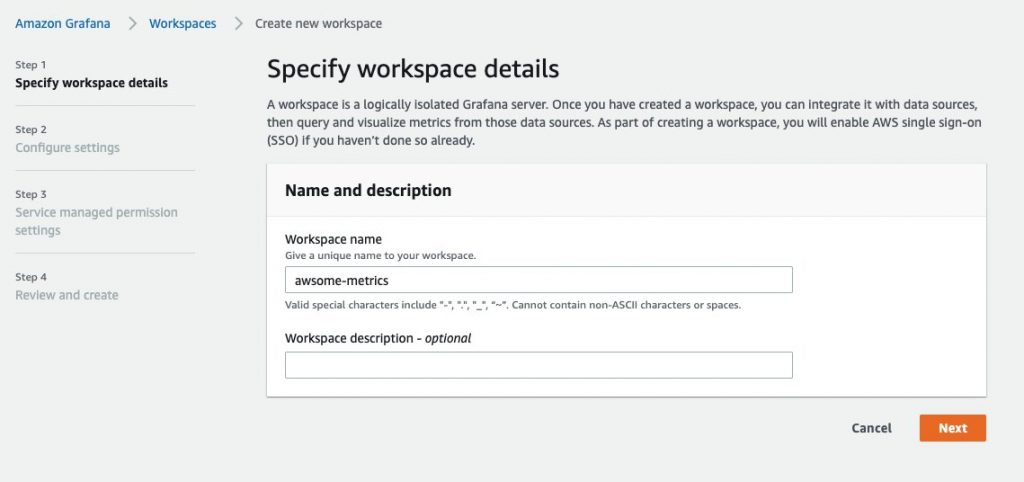
Create new AMG workspace
Next, you need to define user and data access permissions. Unless you have a use case where you have to or want to manage the underlying IAM role and policy yourself (to have fine-grained control for other AWS services), we suggest that you let AMG manage the creation of IAM roles and policies for accessing your AWS Services data.
In this step you also have to enable AWS Single Sign-On (SSO) for AMG since this is how we manage user authentication to Grafana workspaces:
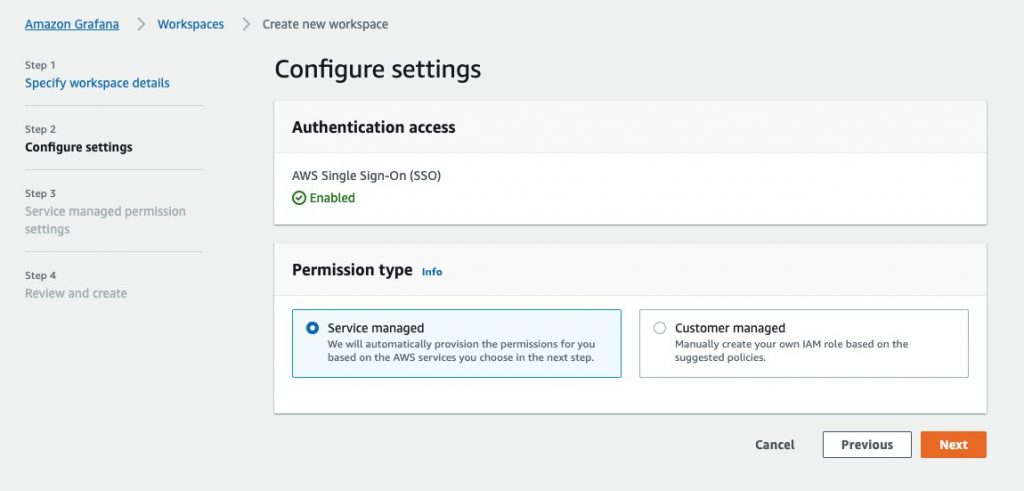
Configure AMG workspace settings
If you haven’t set up users via AWS SSO as mentioned above you can use the inline experience offered by AMG and click Create user at this step:
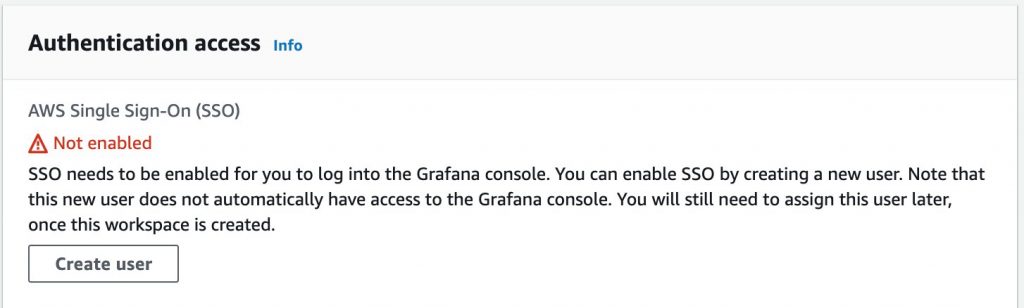
Enable SSO, create user inline
Then fill in the details in the form, that is, provide their email address and first as well as last name:
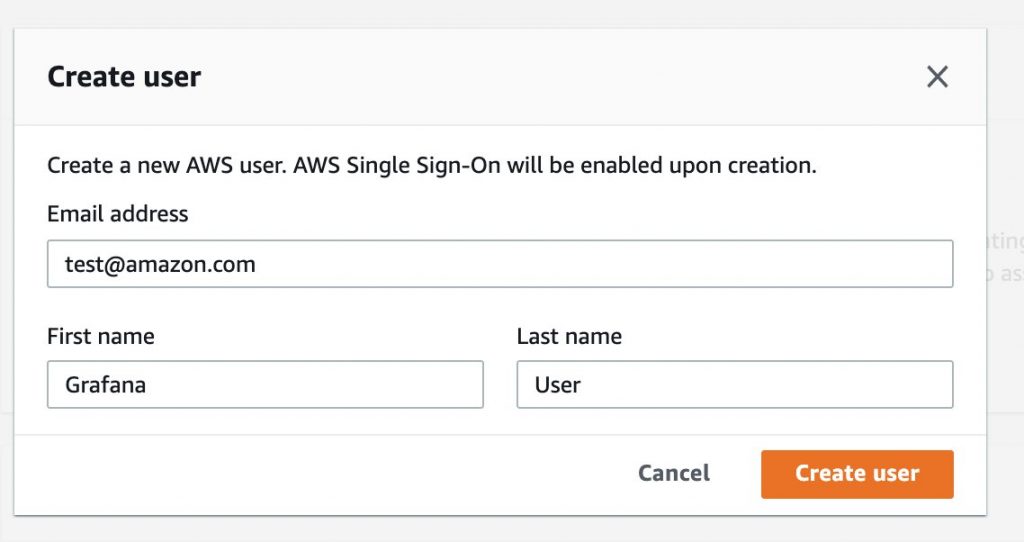
Create SSO user
You should quickly get a confirmation mail with the invitation:
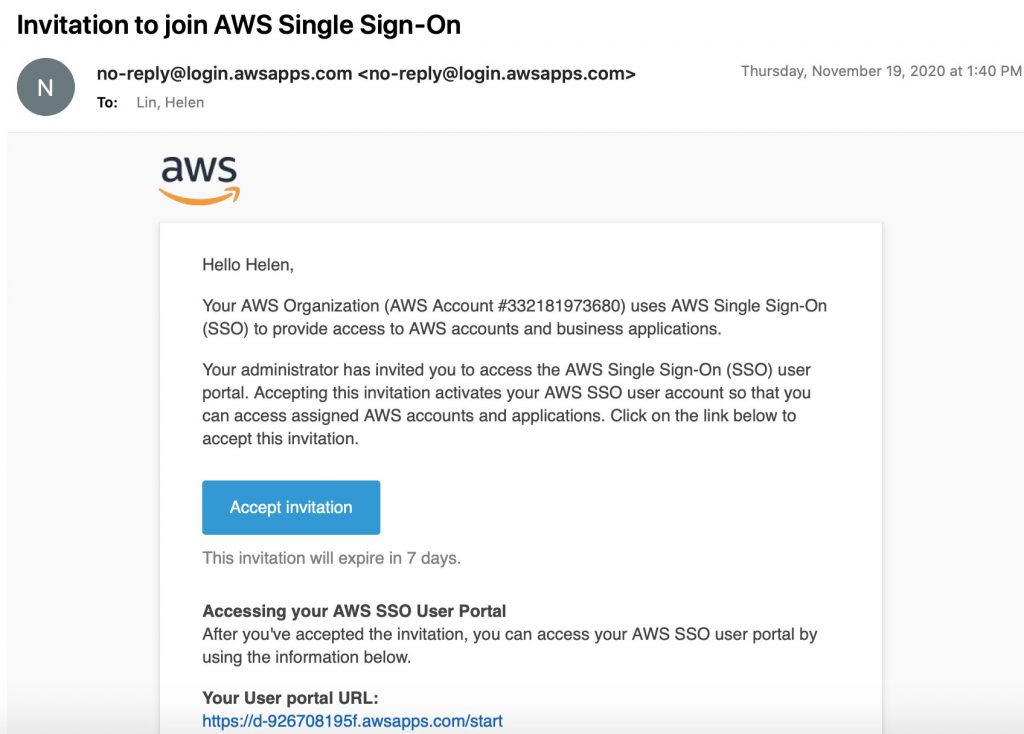
Invitation mail for SSO user
The user (in our case grafana-user) can now use the URL provided by SSO (something like d-xxxxx-awsapps.com/start) or the specific Grafana workspace URL from the workspace details console page to log into their environment where they will be prompted to change their password using the one-time password that you as an admin get from SSO and share with them (see above screen shot).
Back to the AMG workspace setup: We’re almost done, we now need to tell AMG the data sources from which we want to consume and visualize data. To be able to try out everything, we have selected all of the following, but you may want to restrict to the necessary subset for your use case:
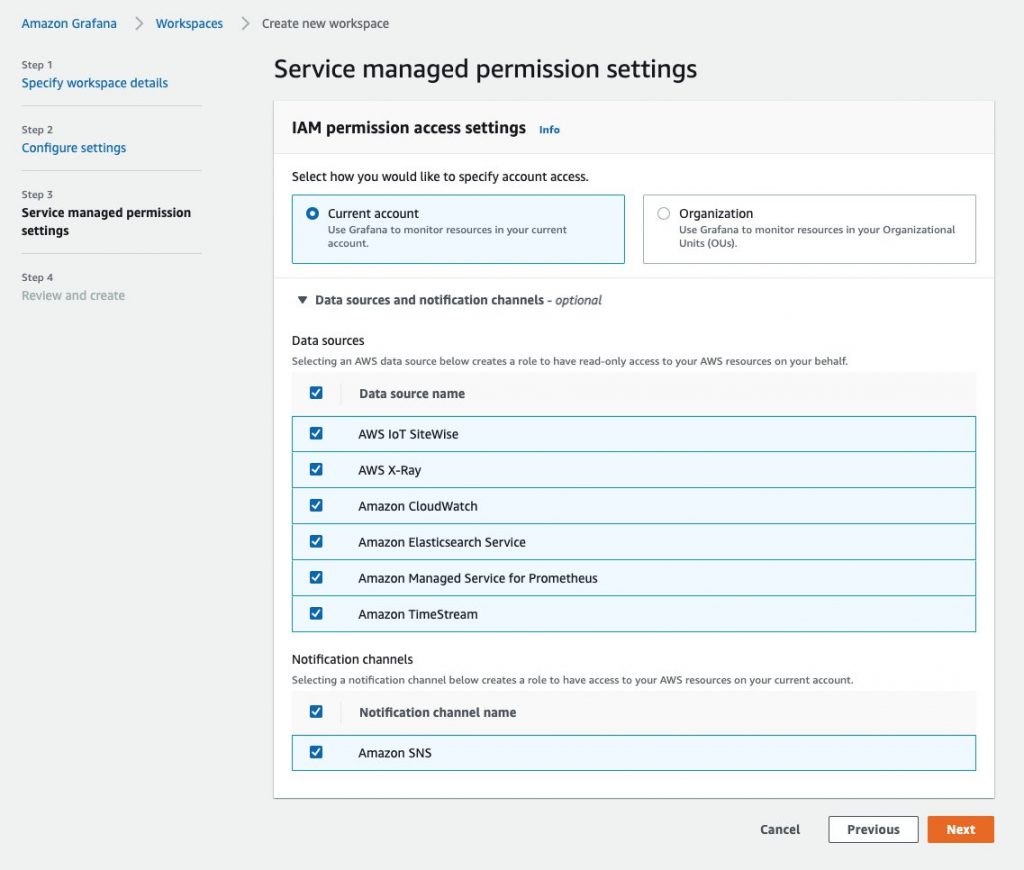
AMG workspace permissions
As usual, you will have a final opportunity to review your settings and then confirm the creation of the AMG workspace:
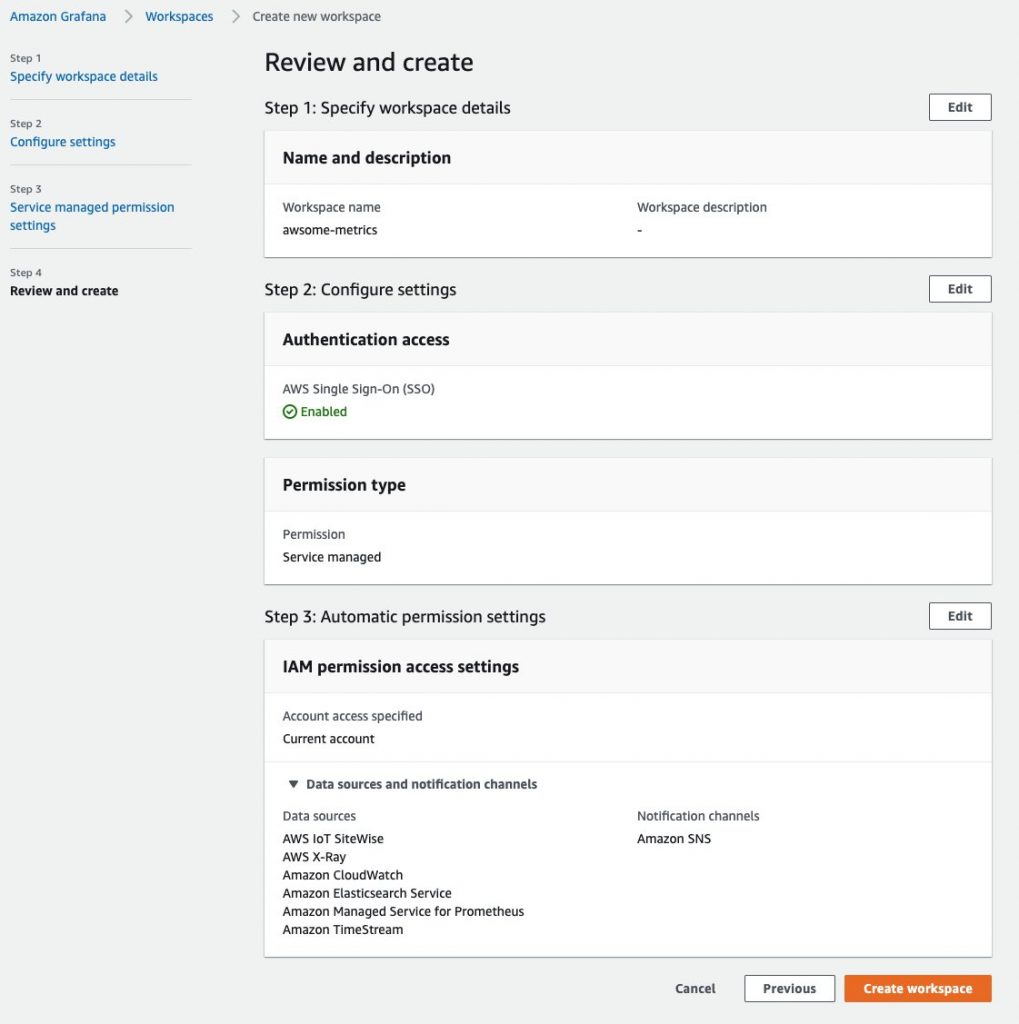
AMG workspace creation review
Once the workspace is created, you can assign users access to the Grafana workspace. You can either assign an individual user from AWS SSO, or you can choose to assign a user group:
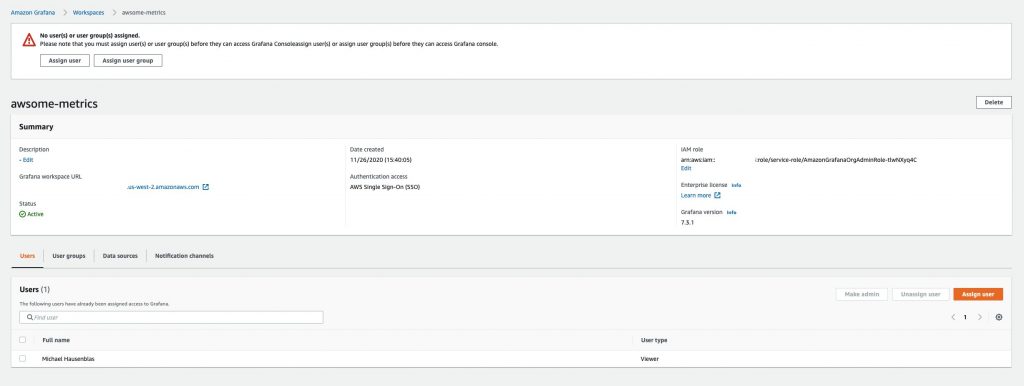
AMG workspace, assign user
Now we’re done from an administrative point of view, so let’s switch gears. We can use the SSO user from above to gain access to the AMG workspace. Now you can click on the Grafana workspace URL from the workspace details page, as shown in the image above, to log into your Grafana workspace using the SSO credentials (user grafana-user) and you should see AMG enabled and ready for you to access:
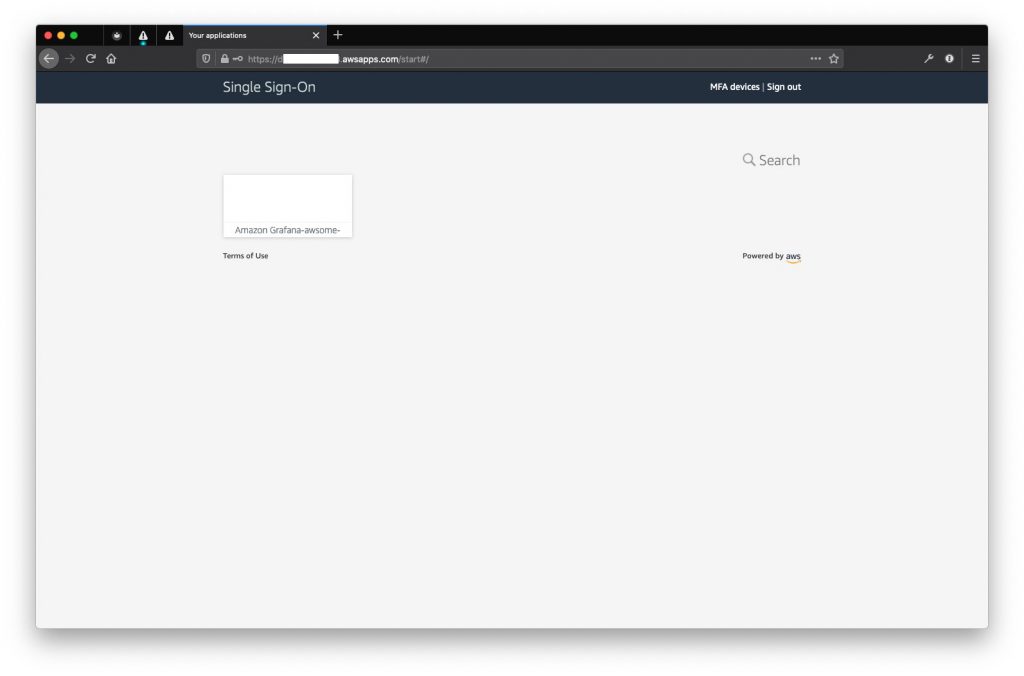
SSO landing page with AMG listed
Now all you have to do is to click on the AMG icon and you’re logged into your Grafana workspace:
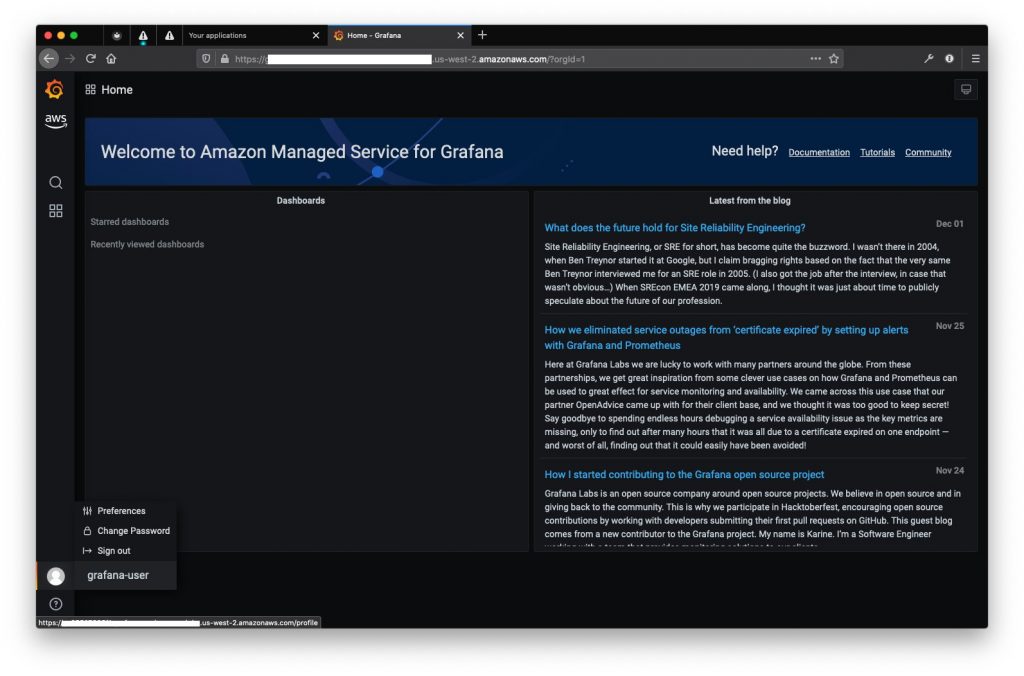
Grafana landing page
The setup is completed with this and we’re ready to use AMG. Let’s start with consuming data from Prometheus.
Integration with Amazon Managed Service for Prometheus (AMP) and other data sources
Amazon Managed Service for Grafana supports a variety of datasources such as Amazon Managed Service for Prometheus, Amazon CloudWatch, AWS X-Ray, Amazon Elasticsearch, Amazon Timestream, AWS IoT SiteWise plugin, and several others. The full-list of data sources can be found here.
AMG can auto-discover the accounts and resources you have for the AWS data-sources and auto-configure based on the permissions setup using CloudFormation.
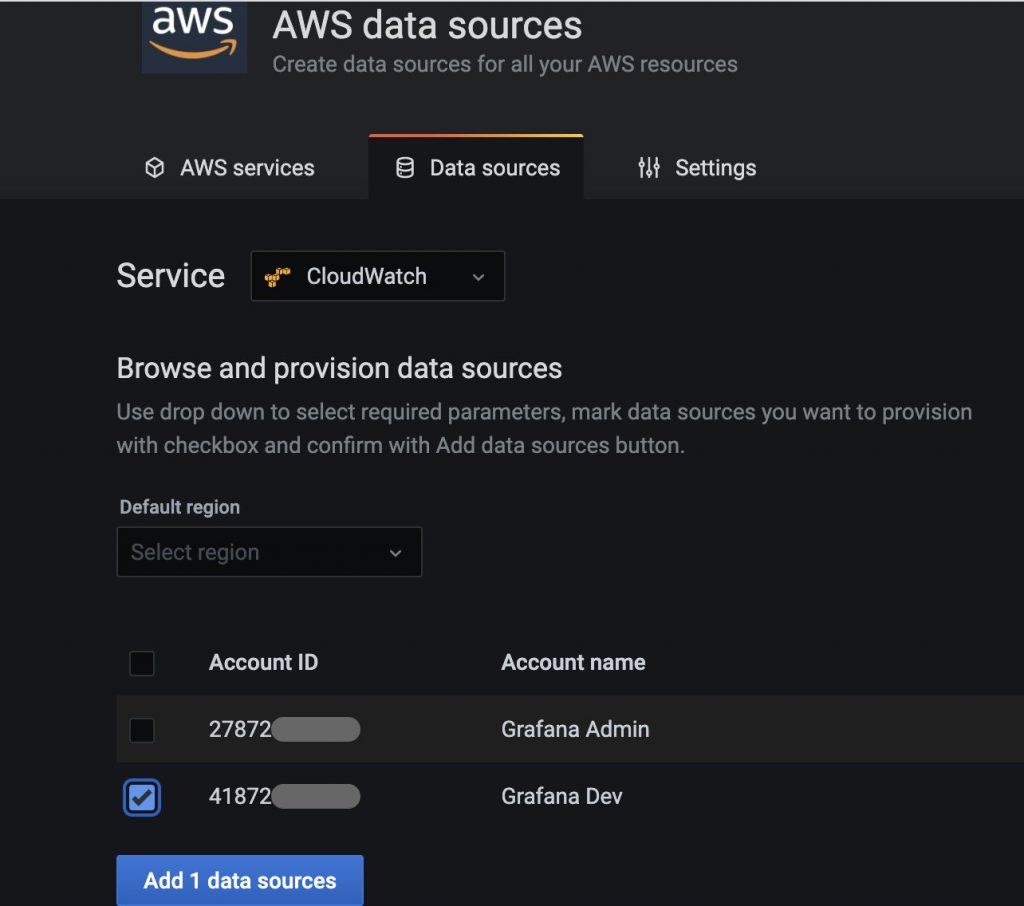
Auto-detected AWS data sources
Provisioning a datasource
This option discovers the accounts and resources you have for the six AWS Services that AMG natively integrates with. Based on the permissions you granted during workflow creation, you can now just check the box for the account or resource you want to add, and AMG will automatically configure the data source with the right IAM role permissions without you having to manually copy and paste.
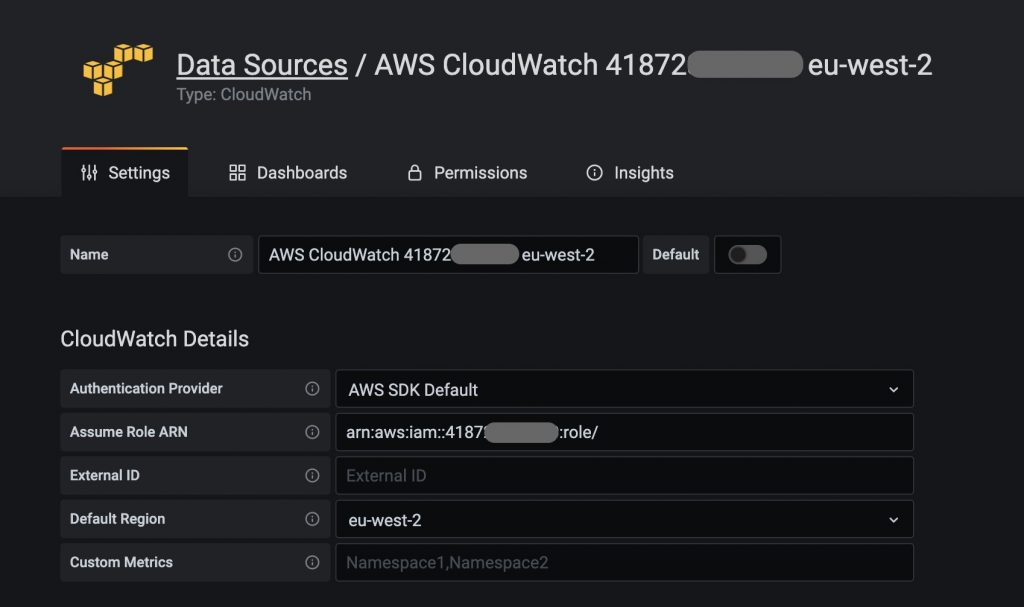
Manually configuring an AWS data source
You can also manually configure the data sources by following the steps below:
- Select the Datasource plugin
- Choose from one of the following authentication mechanisms:
- Access & Secret key
- Credentials file
- ARN of the AssumeRole to authenticate into your AWS account
- Select a default AWS Region (optional)
In this example, we are connecting to an Amazon Managed Prometheus (AMP) data source:
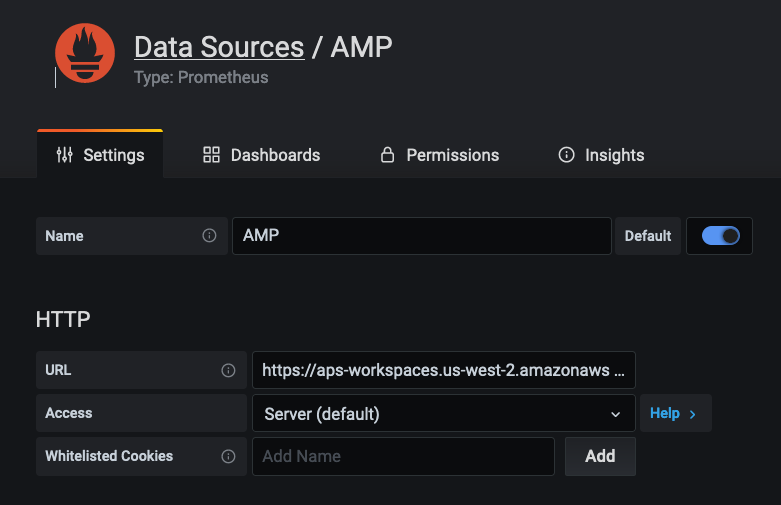
Connecting to AMP datasource manually
Once connected, you will be able to create dashboard panels by selecting the newly connected data source and query metrics using PromQL. Here is a screenshot showing metrics from an EKS cluster queried on an AMP data source.
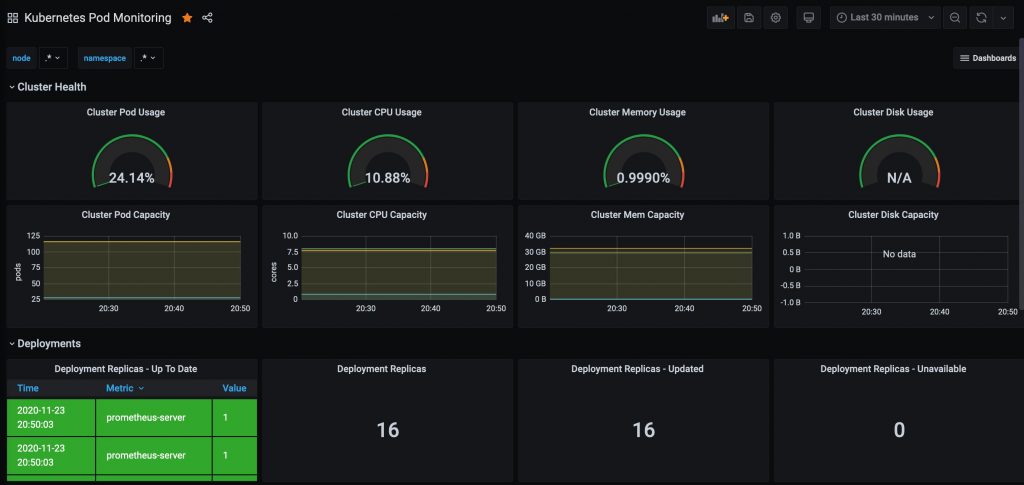
EKS Pod Metrics dashaboard
Out-of-the-box Dashboards
Several AWS datasource plug-ins come with many out-of-the-box dashboards to help you get started quickly. You can find them under the Dashboards tab as shown below.
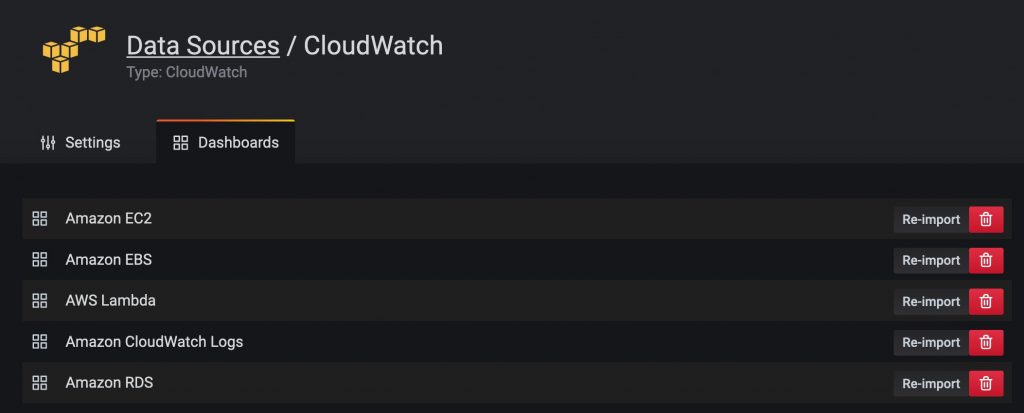
List of out-of-the-box dashboards for Amazon CloudWatch
You can easily import a dashboard by clicking the Import button. Below you can see a screenshot of the Amazon EC2 dashboard.
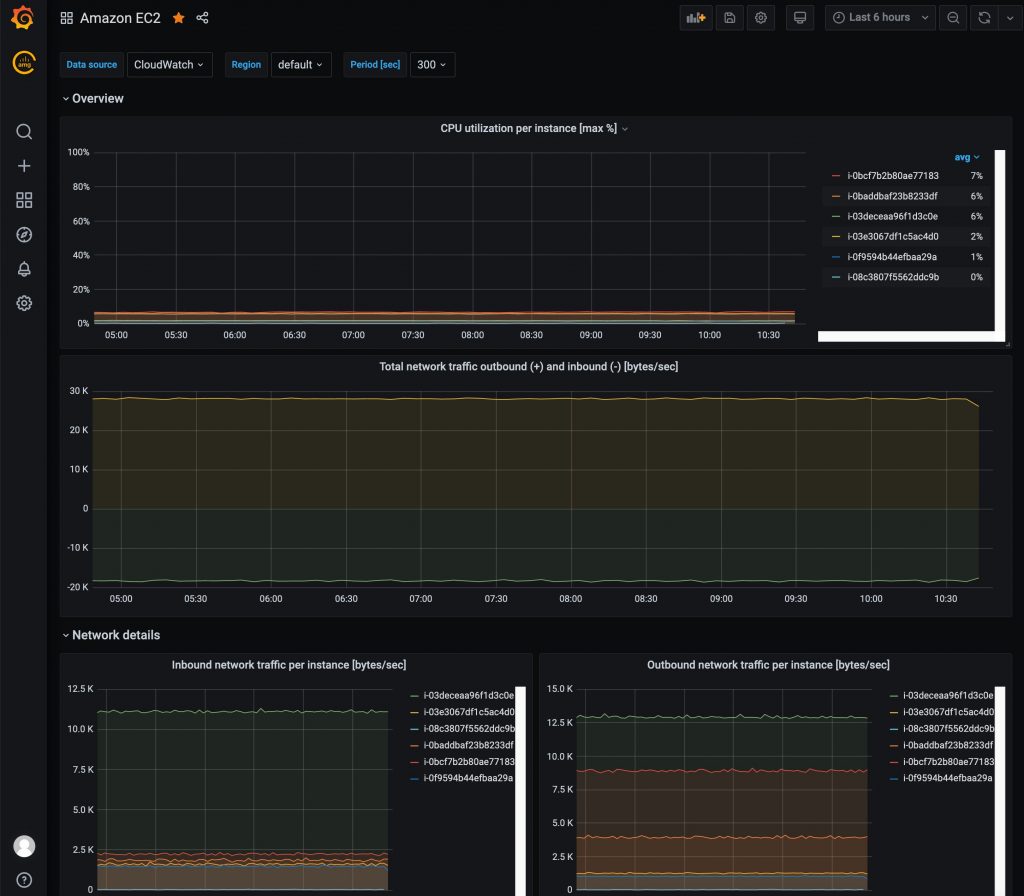
EC2 Dashboard
Creating custom dashboards
Grafana supports a variety of panel visualizations to create dashboards using a variety of data sources. Below you can see a dashboard showing AWS X-Ray Trace data from the One Observability Demo application. You can use AWS X-Ray filter expressions to create dashboard panels in Grafana to visualize trace data as shown below.
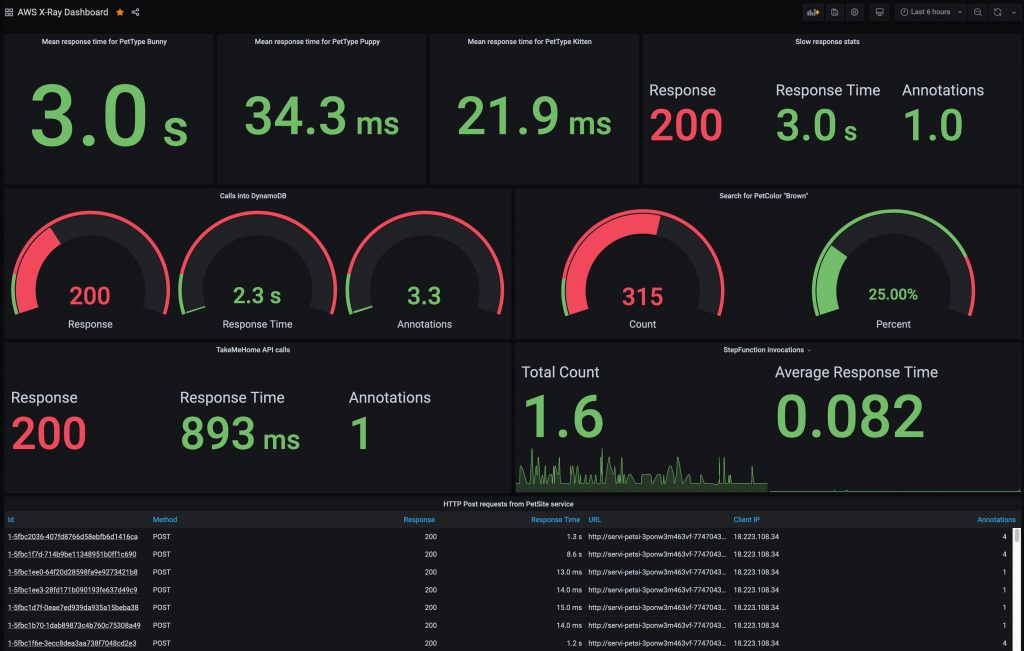
Custom dashboard showing AWS X-Ray trace data
You can also investigate a single trace to see the segment timeline by simply clicking on a Trace ID. Grafana also provides deep links to the AWS X-Ray console where you can use tools such as X-Ray Analytics.
You can take advantage of a large collection of pre-built Grafana dashboards built by the community that can be easily imported into your Grafana workspace and provide a domain specific quick start to visualizing and investigating observability data for a variety of popular data sources.
Conclusion
With AMG (and AMP), you can now use Grafana and Prometheus without having to worry about the operational management of maintaining infrastructure resources, and let AWS take care of the undifferentiated heavy lifting.
More importantly, you can rely on open standards such as CNCF OpenTelemetry along with our own AWS Distro for OpenTelemetry that, together with our open source-based, fully managed services for Grafana and Prometheus, enable you to build powerful observability on AWS.
Authors

Imaya Kumar Jagannathan
Imaya is a Senior Solution Architect focused on Amazon CloudWatch and AWS X-Ray. He is passionate about Monitoring and Observability and has a strong application development and architecture background. He likes working on distributed systems and is excited to talk about micro-service architecture design. He loves programming on C#, working with Containers and Serverless technologies.
 Michael Hausenblas
Michael is an Open Source Product Developer Advocate in the AWS container service team covering open source observability and service meshes. Before AWS, Michael worked at Red Hat, Mesosphere, MapR and as a PostDoc in applied research. Reach him on Twitter via @mhausenblas.