The content below is taken from the original ( Introducing Cloudflare Radar), to continue reading please visit the site. Remember to respect the Author & Copyright.




Unlike the tides, Internet use ebbs and flows with the motion of the sun not the moon. Across the world usage quietens during the night and picks up as morning comes. Internet use also follows patterns that humans create, dipping down when people stopped to applaud healthcare workers fighting COVID-19, or pausing to watch their country’s president address them, or slowing for religious reasons.
And while humans leave a mark on the Internet, so do automated systems. These systems might be doing useful work (like building search engine databases) or harm (like scraping content, or attacking an Internet property).
All the while Internet use (and attacks) is growing. Zoom into any day and you’ll see the familiar daily wave of Internet use reflecting day and night, zoom out and you’ll likely spot weekends when Internet use often slows down a little, zoom out further and you might spot the occasional change in use caused by a holiday, zoom out further and you’ll see that Internet use grows inexorably.
And attacks don’t only grow, they change. New techniques are invented while old ones remain evergreen. DDoS activity continues day and night roaming from one victim to another. Automated scanning tools look for vulnerabilities in anything, literally anything, connected to the Internet.
Sometimes the Internet fails in a country, perhaps because of a cable cut somewhere beneath the sea, or because of government intervention. That too is something we track and measure.
All this activity, good and bad, shows up in the trends and details that Cloudflare tracks to help improve our service and protect our customers. Until today this insight was only available internally at Cloudflare, today we are launching a new service, Cloudflare Radar, that shines a light on the Internet’s patterns.
Each second, Cloudflare handles on average 18 million HTTP requests and 6 million DNS requests. With 1 billion unique IP addresses connecting to Cloudflare’s network we have one of the most representative views on Internet traffic worldwide.
And by blocking 72 billion cyberthreats every day Cloudflare also has a unique position in understanding and mitigating Internet threats.
Our goal is to help build a better Internet and we want to do this by exposing insights, threats and trends based on the aggregated data that we have. We want to help anyone understand what is happening on the Internet from a security, performance and usage perspective. Every Internet user should have easy access to answer the questions that they have.
There are three key components that we’re launching today: Radar Internet Insights, Radar Domain Insights and Radar IP Insights.
Radar Internet Insights
At the top of Cloudflare Radar we show the latest news about events that are currently happening on the Internet. This includes news about the adoption of new technologies, browsers or operating systems. We are also keeping all users up to date with interesting events around developments in Internet traffic. This could be traffic patterns seen in specific countries or patterns related to events like the COVID-19 pandemic.

Sign up for Radar Alerts to always stay up-to-date.
Below the news section users can find rapidly updated trend data. All of which can be viewed worldwide or by country. The data is available for several time frames: last hour, last 24 hours, last 7 days. We’ll soon make available the 30 days time frame to help explore longer term trends.
Change in Internet traffic
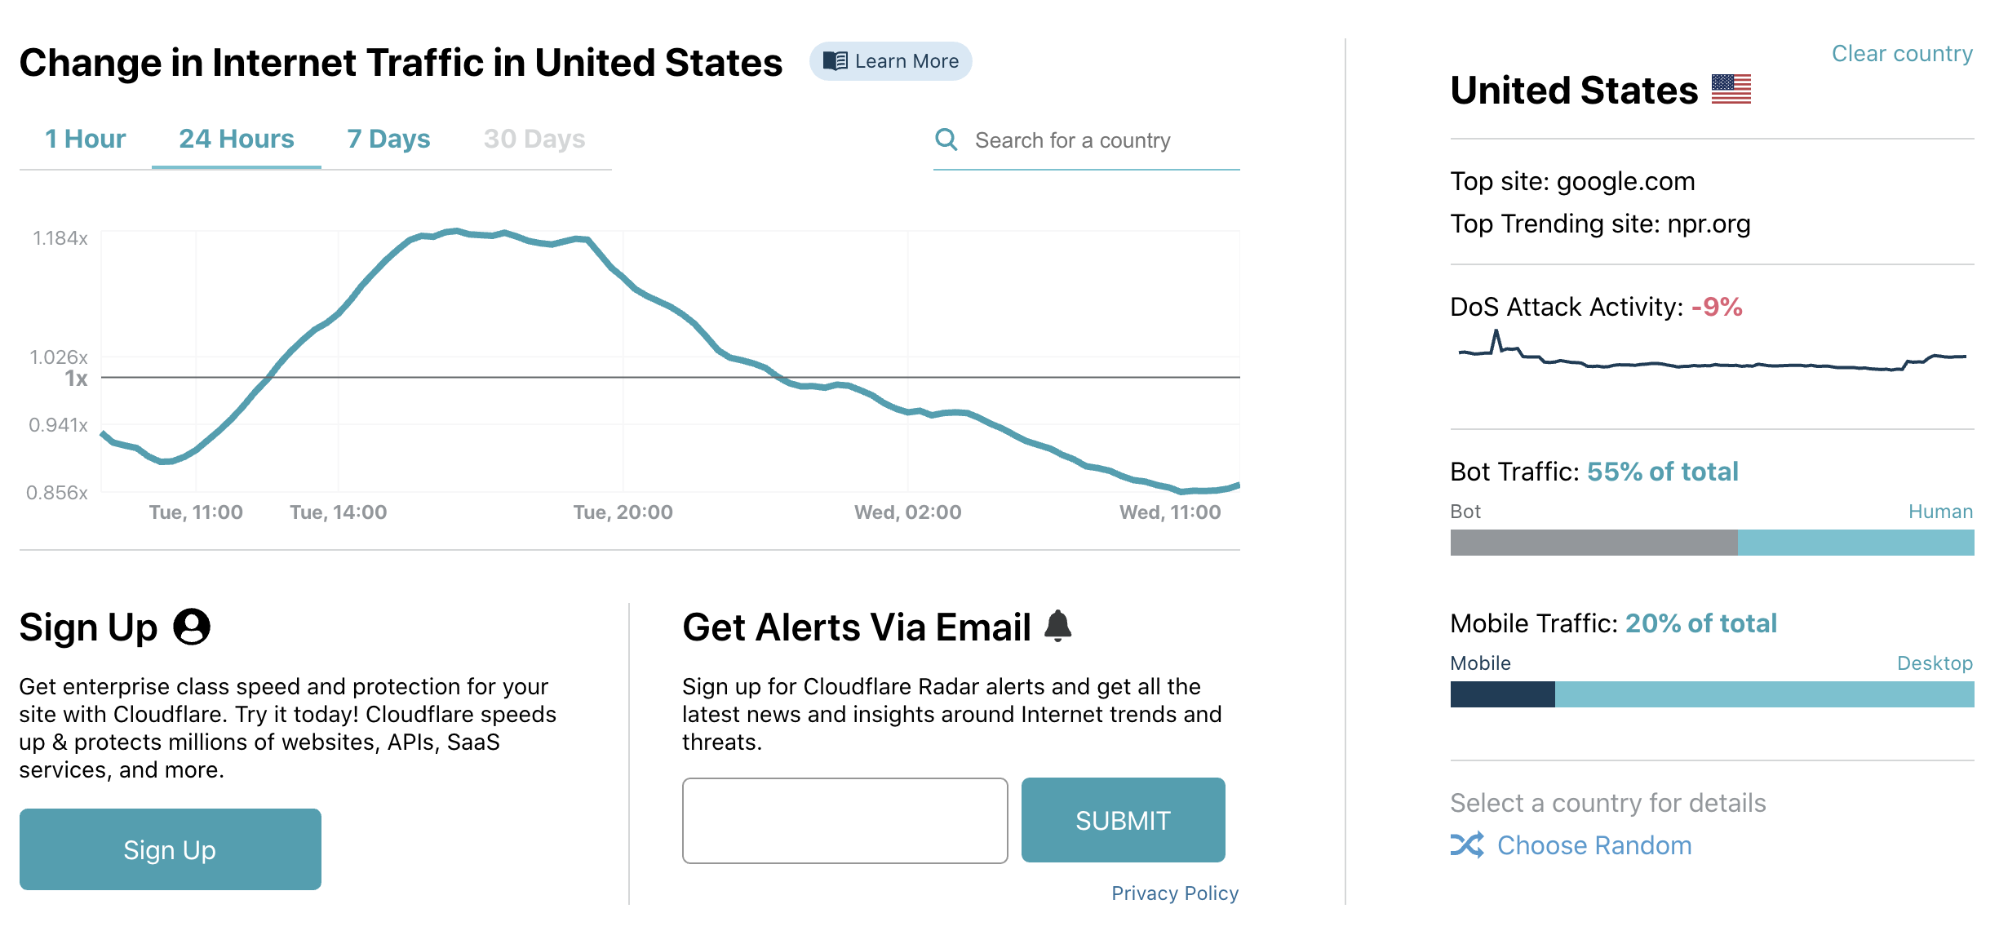
You can drill down on specific countries and Cloudflare Radar will show you the change in aggregate Internet traffic seen by our network for that country. We also show an info box on the right with a snapshot of interesting data points.
Most popular and trending domains
Worldwide and for individual countries we have an algorithm calculating which domains are most popular and have recently started trending (i.e. have seen a large change in popularity). Services with multiple domains and subdomains are aggregated to ensure best comparability. We show here the relative rank of domains and are able to spot big changes in ranking to highlight new trends as they appear.

The trending domains section are still in beta as we are training our algorithm to best detect the next big things as they emerge.
There is also a search bar that enables a user to search for a specific domain or IP address to get detailed information about it. More on that below.
Attack activity
The attack activity section gives information about different types of cyberattacks observed by Cloudflare. First we show the attacks mitigated by our Layer 3 and 4 Denial of Service prevention systems. We show the used attack protocol as well as the change in attack volume over the selected time frame.

Secondly, we show Layer 7 threat information based on requests that we blocked. Layer 7 requests get blocked by a variety of systems (such as our WAF, our layer 7 DDoS mitigation system and our customer configurable firewall). We show the system responsible for blocking as well as the change of blocked requests over the selected time frame.

Technology Trends
Based on the analytics we handle on HTTP requests we are able to show trends over a diverse set of data points. This includes the distribution of mobile vs. desktop traffic, or the percentage of traffic detected as coming from bots. We also dig into longer term trends like the use of HTTPS or the share of IPv6.
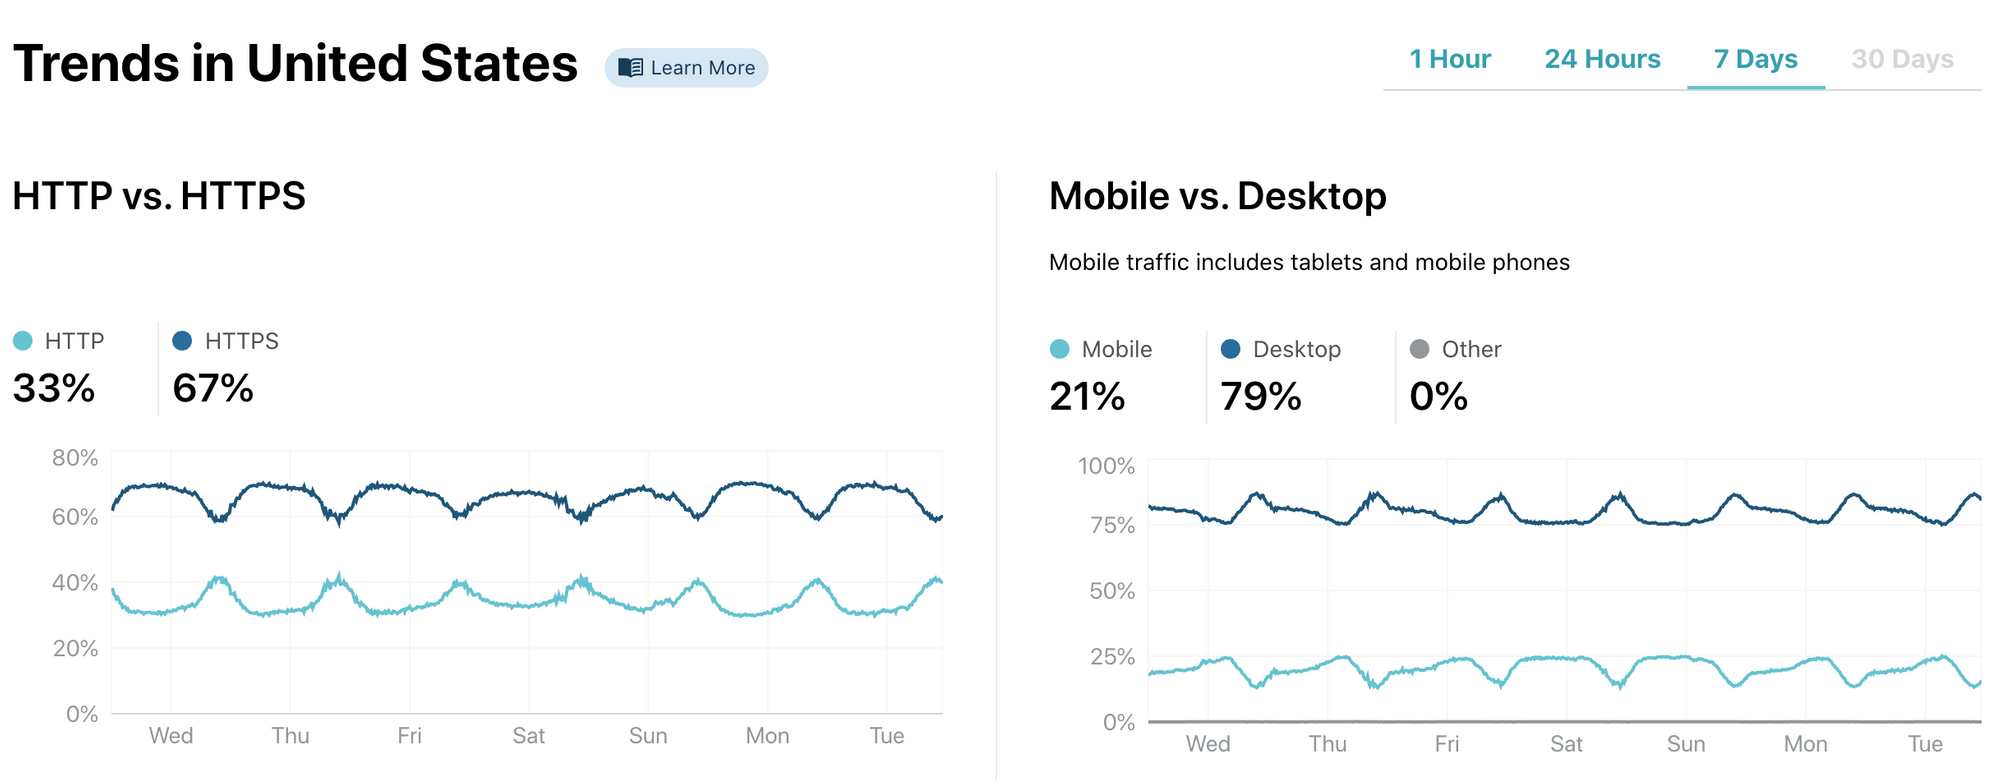
The bottom section shows the top browsers worldwide or for the selected country. In this example we selected Vietnam and you can see that over 6% of users are using Cốc Cốc a local browser.

Radar Domain Insights
We give users the option to dig in deeper on an individual domain. Giving the opportunity to get to know the global ranking as well as security information. This enables everyone to identify potential threats and risks.
To look up a domain or hostname in Radar by typing it in the search box within the top domains on the Radar Internet Insights Homepage.

For example, suppose you search for cloudflare.com. You’ll get sent to a domain-specific page with information about cloudflare.com.

At the top we provide an overview of the domain’s configuration with Domain Badges. From here you can, at a glance, understand what technologies the domain is using. For cloudflare.com you can see that it supports TLS, IPv6, DNSSEC and eSNI. There’s also an indication of the age of the domain (since registration) and its worldwide popularity.
Below you find the domain’s content categories. If you find a domain that is in the wrong category, please use our Domain Categorization Feedback to let us know.
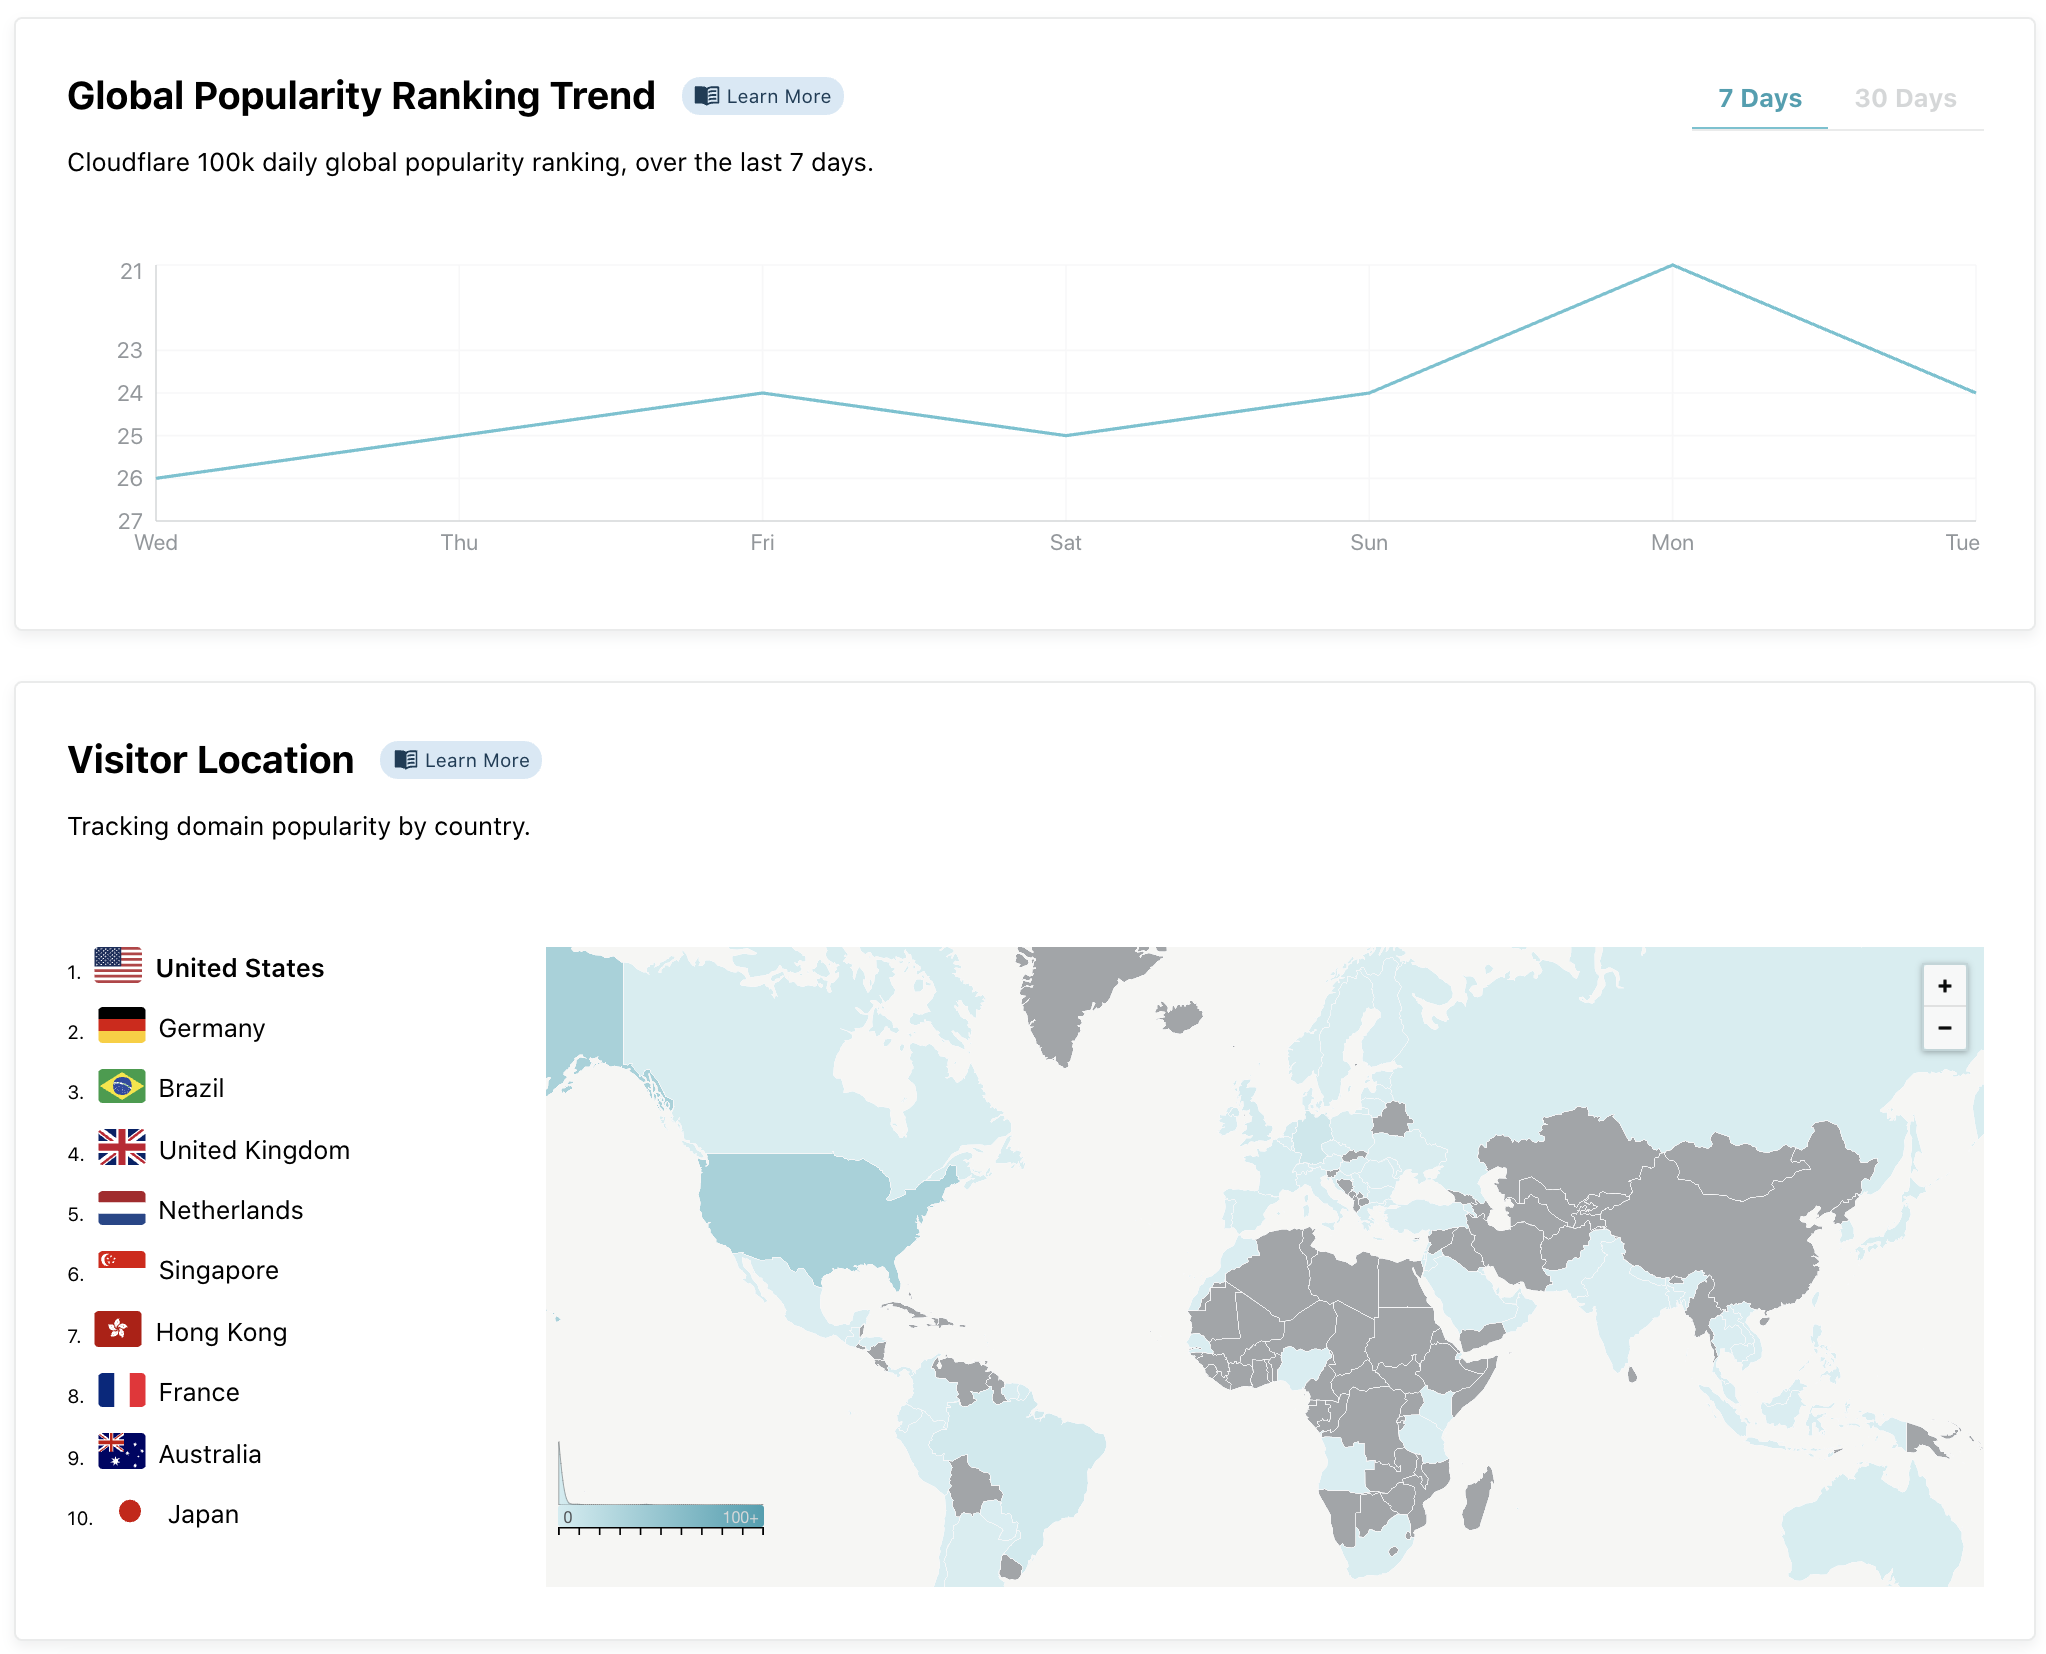
We also show global popularity trends from our domain ranking formula. For domains with a global audience there’s also a map giving information about popularity by country.
Radar IP Insights
For an individual IP address (instead of a domain) we show different information. To look up an IP address simply insert it in the search bar within the top domains on the Radar Internet Insights. For a quick lookup of your own IP just open radar.cloudflare.com/me.

For IPs we show the network (the ASN) and geographic information. For your own IP we also show more detailed location information as well as an invitation to check the speed of your Internet connection using speed.cloudflare.com.
Next Steps
The current product is just the beginning of Cloudflare’s approach to making knowledge about the Internet more accessible. Over the next few weeks and months we will add more data points and the 30 days time frame functionality. And we’ll allow users to filter the charts not only by country but also by categorization (such as by industry).
Stay tuned for more to come.


