The content below is taken from the original ( Getting to the Core: Benchmarking Cloudflare’s Latest Server Hardware), to continue reading please visit the site. Remember to respect the Author & Copyright.


Maintaining a server fleet the size of Cloudflare’s is an operational challenge, to say the least. Anything we can do to lower complexity and improve efficiency has effects for our SRE (Site Reliability Engineer) and Data Center teams that can be felt throughout a server’s 4+ year lifespan.
At the Cloudflare Core, we process logs to analyze attacks and compute analytics. In 2020, our Core servers were in need of a refresh, so we decided to redesign the hardware to be more in line with our Gen X edge servers. We designed two major server variants for the core. The first is Core Compute 2020, an AMD-based server for analytics and general-purpose compute paired with solid-state storage drives. The second is Core Storage 2020, an Intel-based server with twelve spinning disks to run database workloads.
Core Compute 2020
Earlier this year, we blogged about our 10th generation edge servers or Gen X and the improvements they delivered to our edge in both performance and security. The new Core Compute 2020 server leverages many of our learnings from the edge server. The Core Compute servers run a variety of workloads including Kubernetes, Kafka, and various smaller services.
Configuration Changes (Kubernetes)
| Previous Generation Compute | Core Compute 2020 | |
|---|---|---|
| CPU | 2 x Intel Xeon Gold 6262 | 1 x AMD EPYC 7642 |
| Total Core / Thread Count | 48C / 96T | 48C / 96T |
| Base / Turbo Frequency | 1.9 / 3.6 GHz | 2.3 / 3.3 GHz |
| Memory | 8 x 32GB DDR4-2666 | 8 x 32GB DDR4-2933 |
| Storage | 6 x 480GB SATA SSD | 2 x 3.84TB NVMe SSD |
| Network | Mellanox CX4 Lx 2 x 25GbE | Mellanox CX4 Lx 2 x 25GbE |
Configuration Changes (Kafka)
| Previous Generation (Kafka) | Core Compute 2020 | |
|---|---|---|
| CPU | 2 x Intel Xeon Silver 4116 | 1 x AMD EPYC 7642 |
| Total Core / Thread Count | 24C / 48T | 48C / 96T |
| Base / Turbo Frequency | 2.1 / 3.0 GHz | 2.3 / 3.3 GHz |
| Memory | 6 x 32GB DDR4-2400 | 8 x 32GB DDR4-2933 |
| Storage | 12 x 1.92TB SATA SSD | 10 x 3.84TB NVMe SSD |
| Network | Mellanox CX4 Lx 2 x 25GbE | Mellanox CX4 Lx 2 x 25GbE |
Both previous generation servers were Intel-based platforms, with the Kubernetes server based on Xeon 6262 processors, and the Kafka server based on Xeon 4116 processors. One goal with these refreshed versions was to converge the configurations in order to simplify spare parts and firmware management across the fleet.
As the above tables show, the configurations have been converged with the only difference being the number of NVMe drives installed depending on the workload running on the host. In both cases we moved from a dual-socket configuration to a single-socket configuration, and the number of cores and threads per server either increased or stayed the same. In all cases, the base frequency of those cores was significantly improved. We also moved from SATA SSDs to NVMe SSDs.
Core Compute 2020 Synthetic Benchmarking
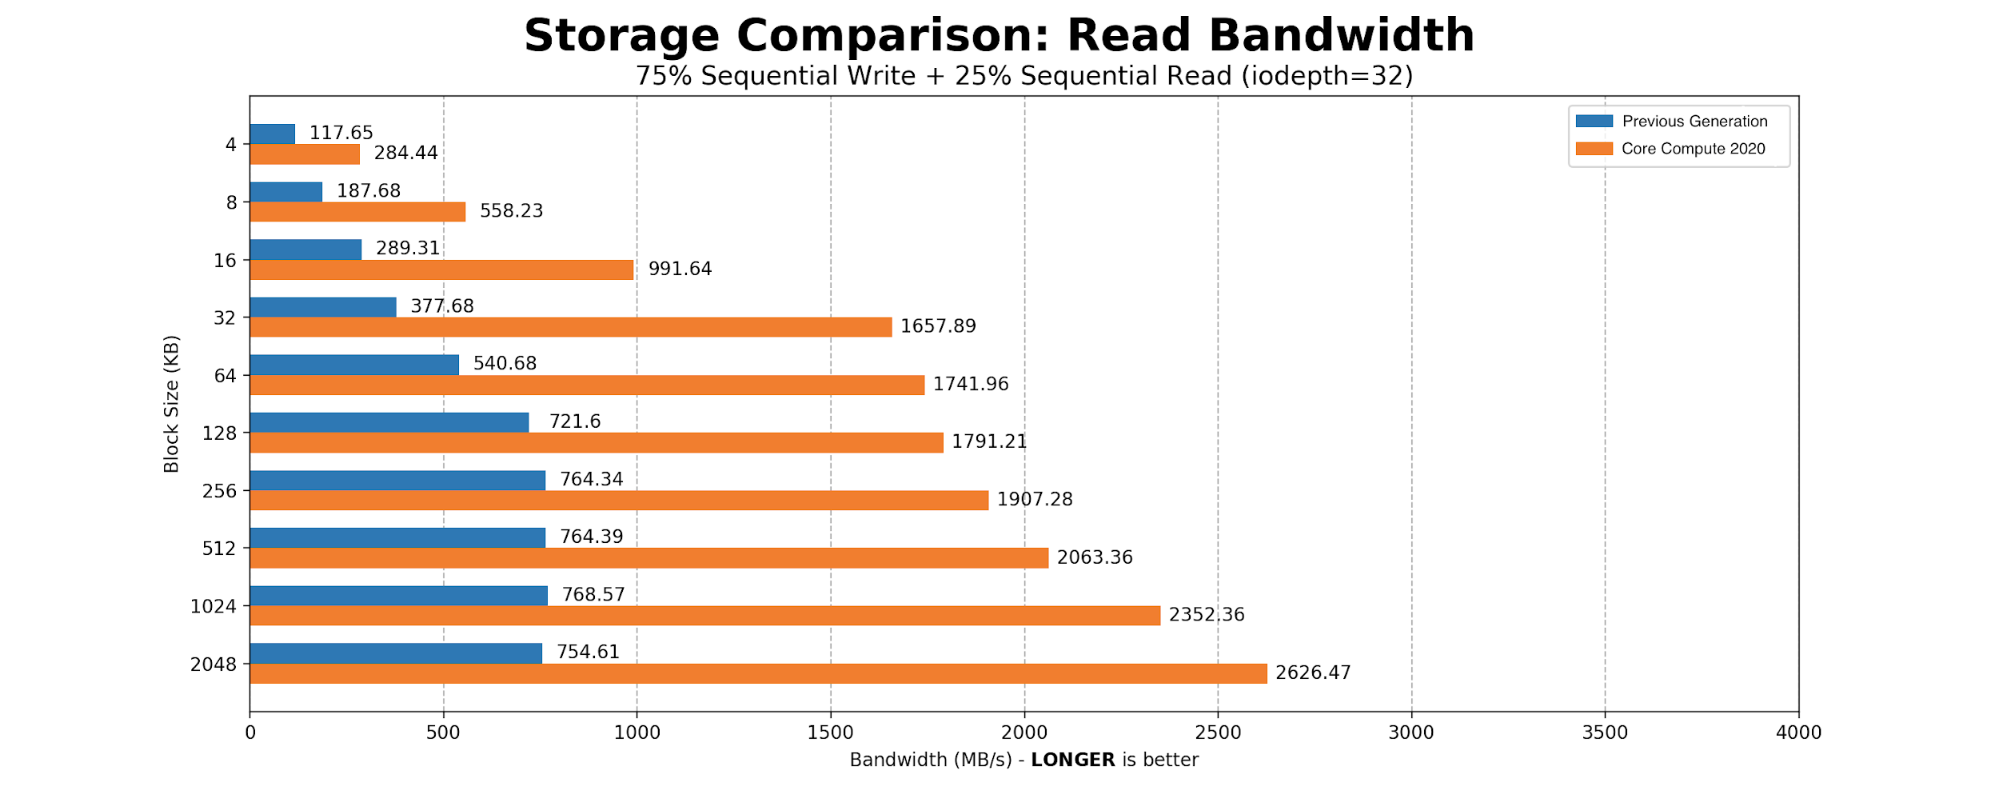
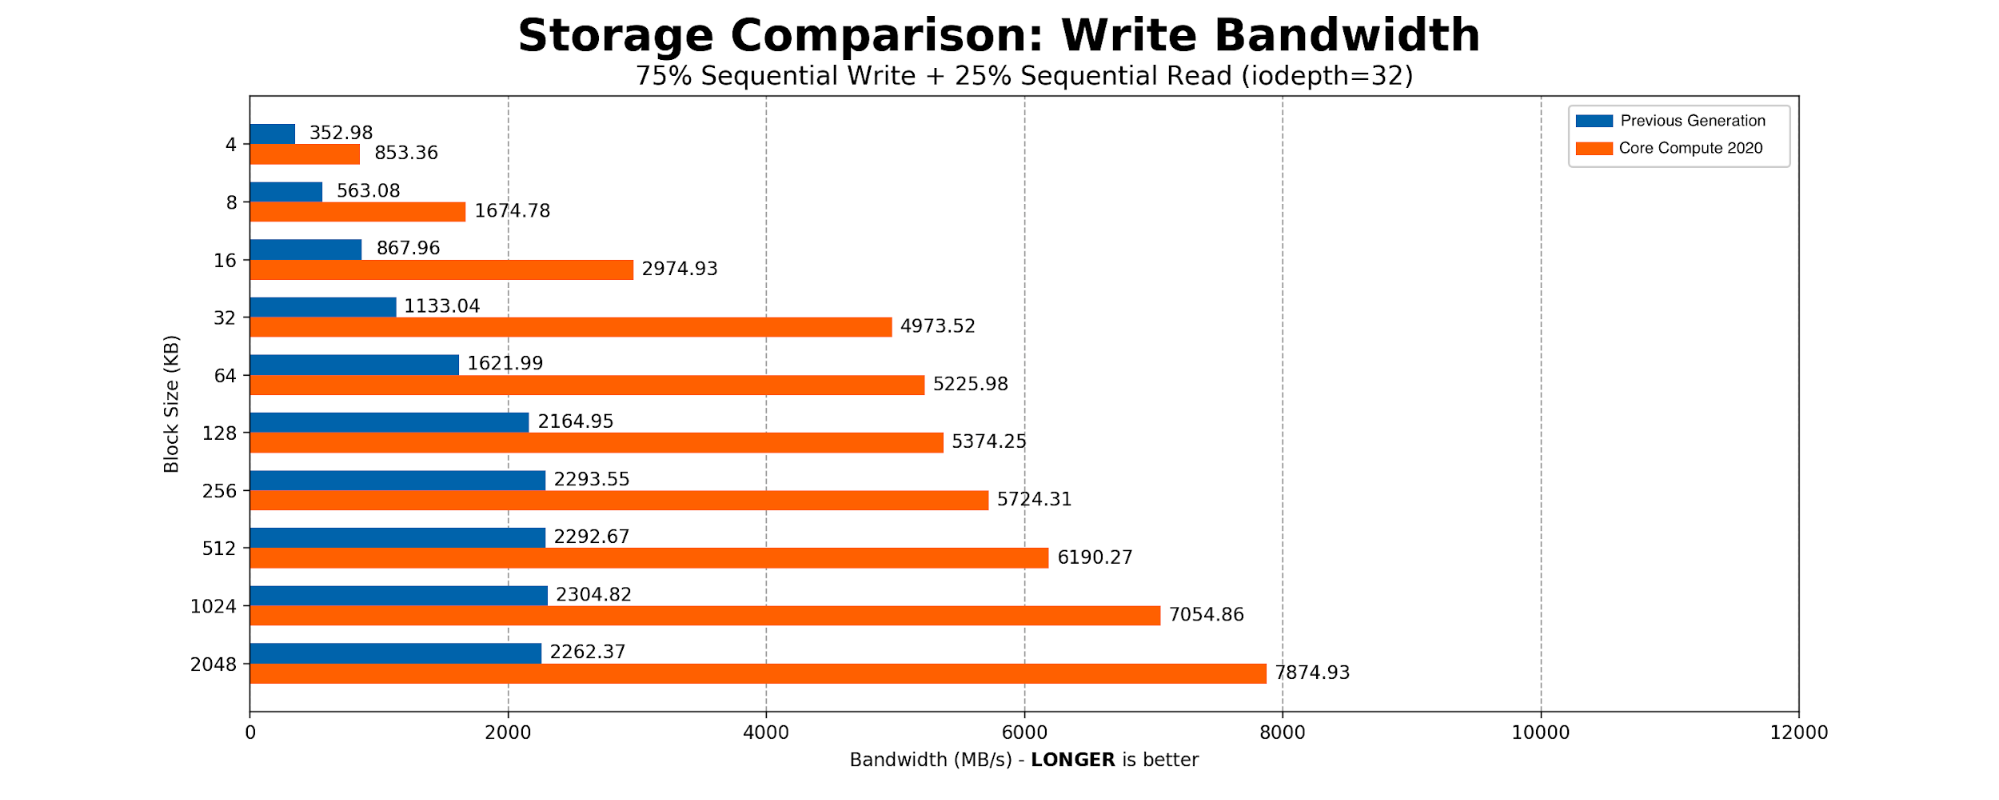
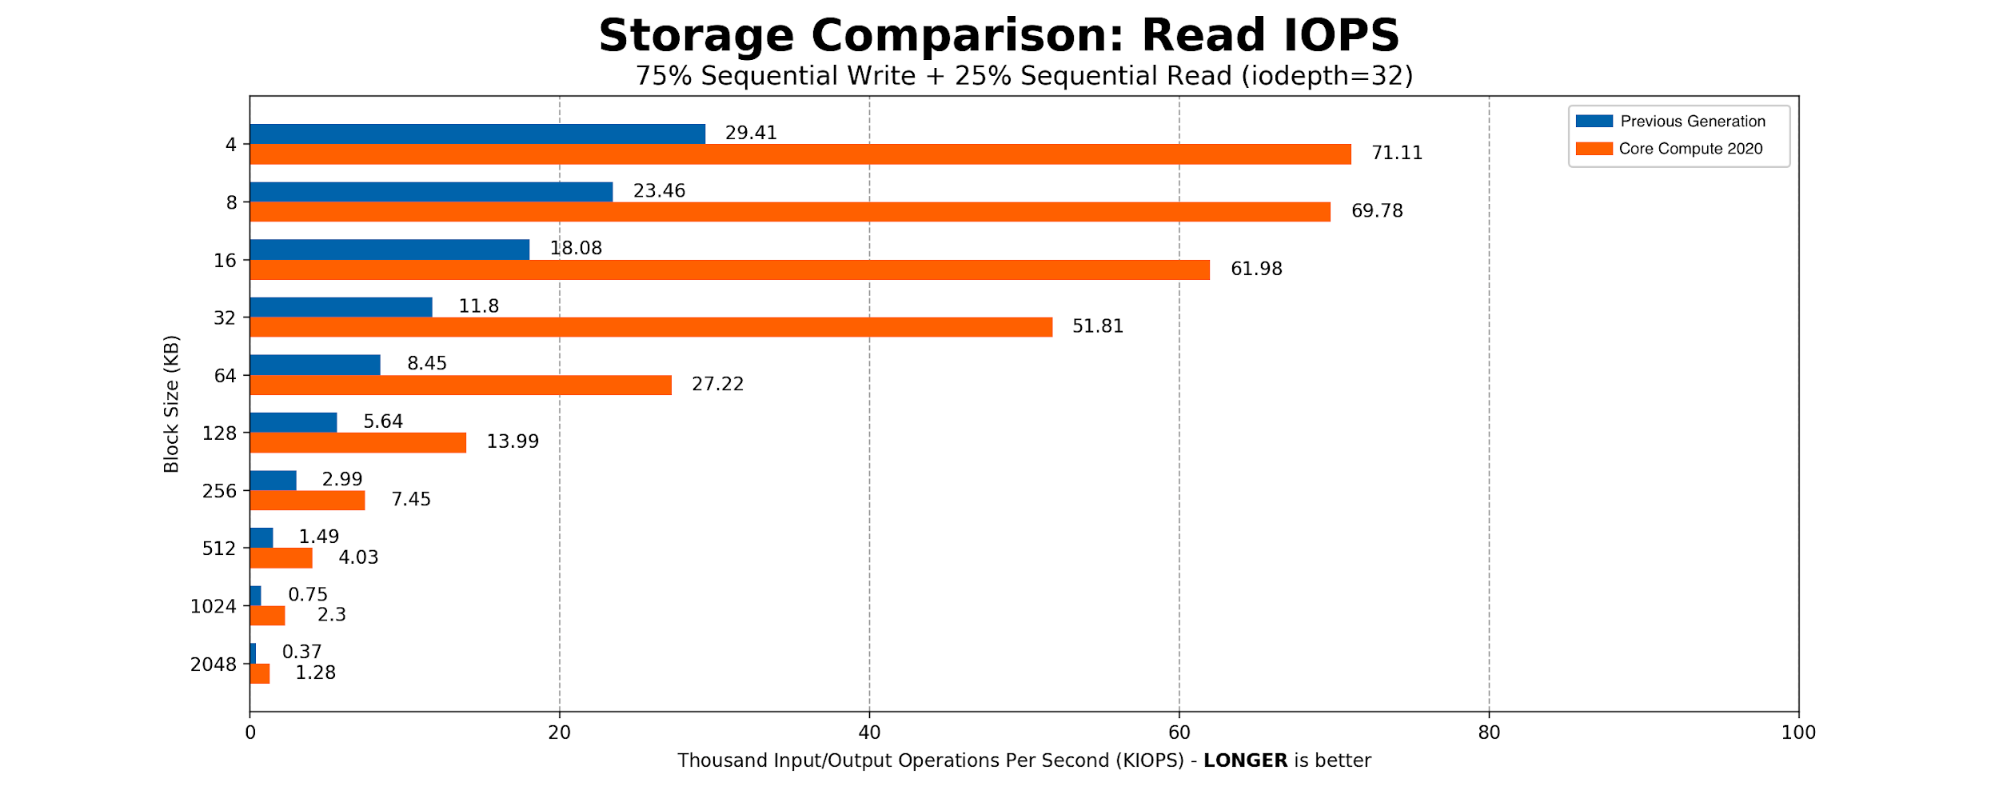
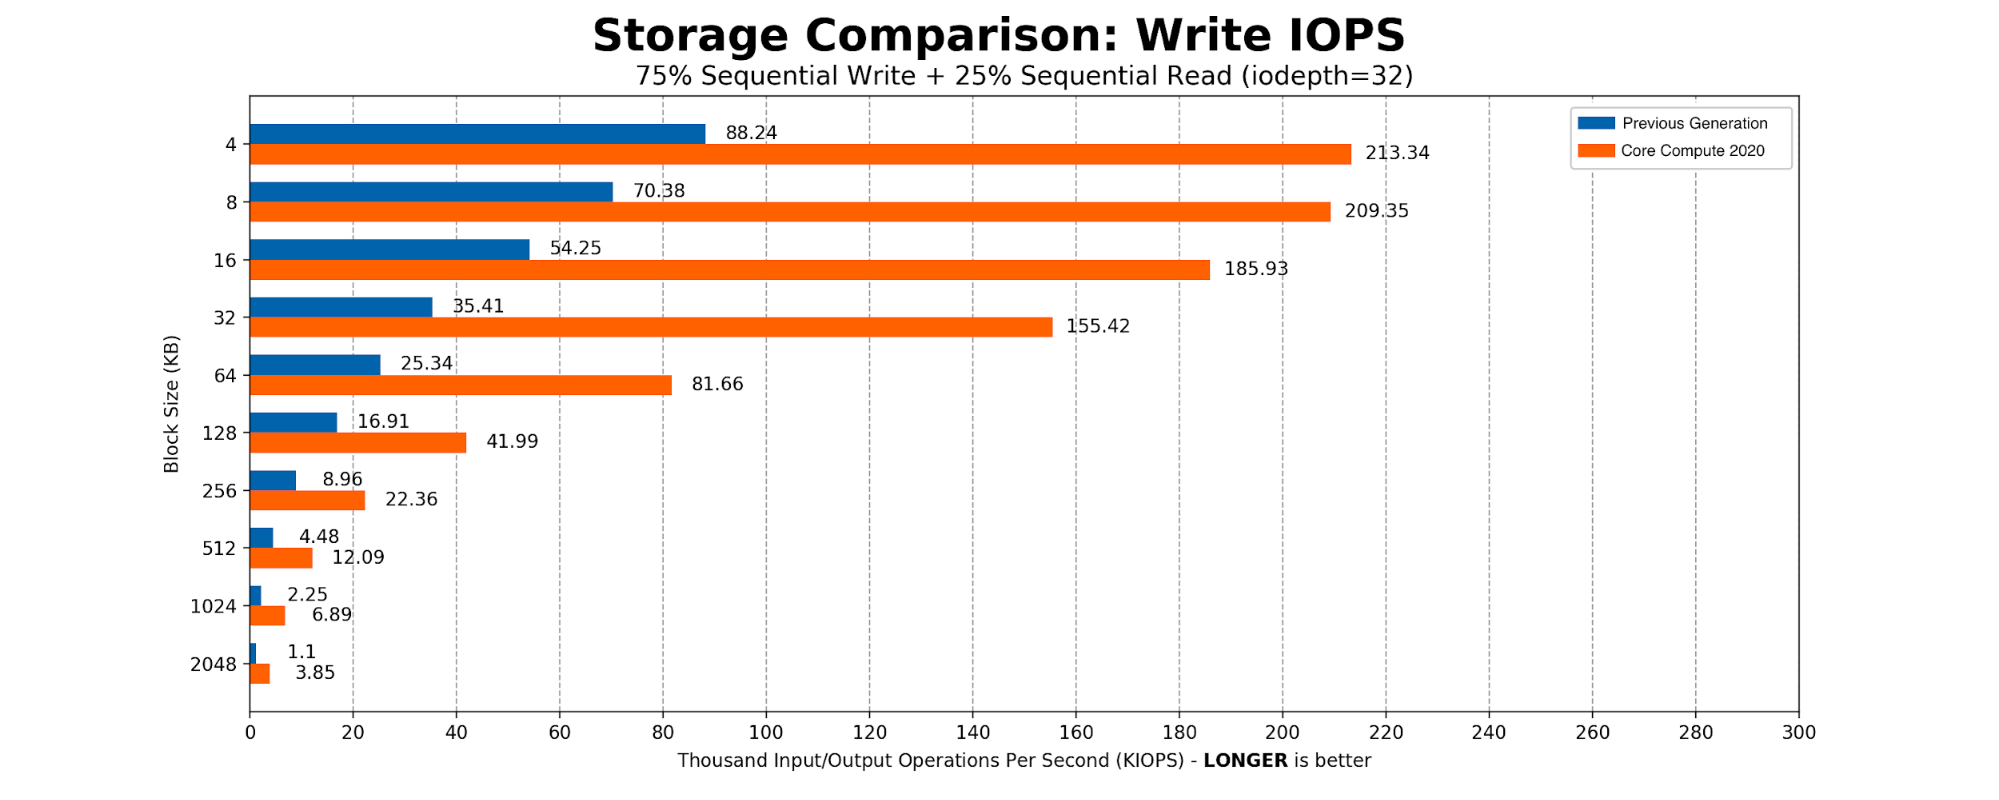
The heaviest user of the SSDs was determined to be Kafka. The majority of the time Kafka is sequentially writing 2MB blocks to the disk. We created a simple FIO script with 75% sequential write and 25% sequential read, scaling the block size from a standard page table entry size of 4096B 4096KB to Kafka’s write size of 2MB. The results aligned with what we expected from an NVMe-based drive.
Core Compute 2020 Production Benchmarking
Cloudflare runs many of our Core Compute services in Kubernetes containers, some of which are multi-core. By transitioning to a single socket, problems associated with dual sockets were eliminated, and we are guaranteed to have all cores allocated for any given container on the same socket.
Another heavy workload that is constantly running on Compute hosts is the Cloudflare CSAM Scanning Tool. Our Systems Engineering team isolated a Compute 2020 compute host and the previous generation compute host, had them run just this workload, and measured the time to compare the fuzzy hashes for images to the NCMEC hash lists and verify that they are a “miss”.
Because the CSAM Scanning Tool is very compute intensive we specifically isolated it to take a look at its performance with the new hardware. We’ve spent a great deal of effort on software optimization and improved algorithms for this tool but investing in faster, better hardware is also important.
In these heatmaps, the X axis represents time, and the Y axis represents “buckets” of time taken to verify that it is not a match to one of the NCMEC hash lists. For a given time slice in the heatmap, the red point is the bucket with the most times measured, the yellow point the second most, and the green points the least. The red points on the Compute 2020 graph are all in the 5 to 8 millisecond bucket, while the red points on the previous Gen heatmap are all in the 8 to 13 millisecond bucket, which shows that on average, the Compute 2020 host is verifying hashes significantly faster.

Core Storage 2020
Another major workload we identified was ClickHouse, which performs analytics over large datasets. The last time we upgraded our servers running ClickHouse was back in 2018.
Configuration Changes
| Previous Generation | Core Storage 2020 | |
|---|---|---|
| CPU | 2 x Intel Xeon E5-2630 v4 | 1 x Intel Xeon Gold 6210U |
| Total Core / Thread Count | 20C / 40T | 20C / 40T |
| Base / Turbo Frequency | 2.2 / 3.1 GHz | 2.5 / 3.9 GHz |
| Memory | 8 x 32GB DDR4-2400 | 8 x 32GB DDR4-2933 |
| Storage | 12 x 10TB 7200 RPM 3.5” SATA | 12 x 10TB 7200 RPM 3.5” SATA |
| Network | Mellanox CX4 Lx 2 x 25GbE | Mellanox CX4 Lx 2 x 25GbE |
CPU Changes
For ClickHouse, we use a 1U chassis with 12 x 10TB 3.5” hard drives. At the time we were designing Core Storage 2020 our server vendor did not yet have an AMD version of this chassis, so we remained on Intel. However, we moved Core Storage 2020 to a single 20 core / 40 thread Xeon processor, rather than the previous generation’s dual-socket 10 core / 20 thread processors. By moving to the single-socket Xeon 6210U processor, we were able to keep the same core count, but gained 17% higher base frequency and 26% higher max turbo frequency. Meanwhile, the total CPU thermal design profile (TDP), which is an approximation of the maximum power the CPU can draw, went down from 165W to 150W.
On a dual-socket server, remote memory accesses, which are memory accesses by a process on socket 0 to memory attached to socket 1, incur a latency penalty, as seen in this table:
| Previous Generation | Core Storage 2020 | |
|---|---|---|
| Memory latency, socket 0 to socket 0 | 81.3 ns | 86.9 ns |
| Memory latency, socket 0 to socket 1 | 142.6 ns | N/A |
An additional advantage of having a CPU with all 20 cores on the same socket is the elimination of these remote memory accesses, which take 76% longer than local memory accesses.
Memory Changes
The memory in the Core Storage 2020 host is rated for operation at 2933 MHz; however, in the 8 x 32GB configuration we need on these hosts, the Intel Xeon 6210U processor clocks them at 2666 MH. Compared to the previous generation, this gives us a 13% boost in memory speed. While we would get a slightly higher clock speed with a balanced, 6 DIMMs configuration, we determined that we are willing to sacrifice the slightly higher clock speed in order to have the additional RAM capacity provided by the 8 x 32GB configuration.
Storage Changes
Data capacity stayed the same, with 12 x 10TB SATA drives in RAID 0 configuration for best throughput. Unlike the previous generation, the drives in the Core Storage 2020 host are helium filled. Helium produces less drag than air, resulting in potentially lower latency.
Core Storage 2020 Synthetic benchmarking
We performed synthetic four corners benchmarking: IOPS measurements of random reads and writes using 4k block size, and bandwidth measurements of sequential reads and writes using 128k block size. We used the fio tool to see what improvements we would get in a lab environment. The results show a 10% latency improvement and 11% IOPS improvement in random read performance. Random write testing shows 38% lower latency and 60% higher IOPS. Write throughput is improved by 23%, and read throughput is improved by a whopping 90%.
| Previous Generation | Core Storage 2020 | % Improvement | |
|---|---|---|---|
| 4k Random Reads (IOPS) | 3,384 | 3,758 | 11.0% |
| 4k Random Read Mean Latency (ms, lower is better) | 75.4 | 67.8 | 10.1% lower |
| 4k Random Writes (IOPS) | 4,009 | 6,397 | 59.6% |
| 4k Random Write Mean Latency (ms, lower is better) | 63.5 | 39.7 | 37.5% lower |
| 128k Sequential Reads (MB/s) | 1,155 | 2,195 | 90.0% |
| 128k Sequential Writes (MB/s) | 1,265 | 1,558 | 23.2% |
CPU frequencies
The higher base and turbo frequencies of the Core Storage 2020 host’s Xeon 6210U processor allowed that processor to achieve higher average frequencies while running our production ClickHouse workload. A recent snapshot of two production hosts showed the Core Storage 2020 host being able to sustain an average of 31% higher CPU frequency while running ClickHouse.
| Previous generation (average core frequency) | Core Storage 2020 (average core frequency) | % improvement | |
|---|---|---|---|
| Mean Core Frequency | 2441 MHz | 3199 MHz | 31% |
Core Storage 2020 Production benchmarking
Our ClickHouse database hosts are continually performing merge operations to optimize the database data structures. Each individual merge operation takes just a few seconds on average, but since they’re constantly running, they can consume significant resources on the host. We sampled the average merge time every five minutes over seven days, and then sampled the data to find the average, minimum, and maximum merge times reported by a Compute 2020 host and by a previous generation host. Results are summarized below.
ClickHouse merge operation performance improvement
(time in seconds, lower is better)
| Time | Previous generation | Core Storage 2020 | % improvement |
|---|---|---|---|
| Mean time to merge | 1.83 | 1.15 | 37% lower |
| Maximum merge time | 3.51 | 2.35 | 33% lower |
| Minimum merge time | 0.68 | 0.32 | 53% lower |
Our lab-measured CPU frequency and storage performance improvements on Core Storage 2020 have translated into significantly reduced times to perform this database operation.
Conclusion
With our Core 2020 servers, we were able to realize significant performance improvements, both in synthetic benchmarking outside production and in the production workloads we tested. This will allow Cloudflare to run the same workloads on fewer servers, saving CapEx costs and data center rack space. The similarity of the configuration of the Kubernetes and Kafka hosts should help with fleet management and spare parts management. For our next redesign, we will try to further converge the designs on which we run the major Core workloads to further improve efficiency.
Special thanks to Will Buckner and Chris Snook for their help in the development of these servers, and to Tim Bart for validating CSAM Scanning Tool’s performance on Compute.


